
|
Home Our Activities Annual Creek Cleanup Arundo Removal Fish Sampling How to Volunteer Creeks Master Plan Creek History Maps Wildlife in the Creeks Otters and Beavers Creek Science Water Quality Bioassessment BMI Lifestyles Creek Structure Native Walnuts About FOC About Us Join Us/Donate Contact Us |
Water Quality AssessmentIn the beginning, the Clean Water Act was enforced by looking at water chemistry – the fewer impurities, the better the quality. However, measuring the chemical composition of flowing water only measures a point in time. Even an hour later, the water in the spot where the measurement was taken will be different. Under the chemical approach, distilled water flowing through a concrete channel would be the ideal – but hardly what most people think of as a healthy creek. Once scientists recognized the limitations of chemical measurement, they moved to biological assessment. This approach measures the populations of certain aquatic bugs called benthic macro invertebrates (BMI). Many aquatic insects spend a year or more in the water as nymphs before they metamorphose into adults. Thus their presence measures water quality over time. Since sensitive bugs can only survive in high quality water, their numbers are used as an indicator of water quality. In California, this means mayflies, stone flies, and caddis flies, which belong respectively to the orders of Ephemoptera, Plecoptera, and Trichoptera (yielding the EPT index). While biological assessment proved a better overall measure of water quality than chemistry, it does not provide a complete picture either. Chemical analysis – both qualitative and quantitative – is indispensable to figuring out what harmful compounds are in the water and at what concentration they begin to affect living things. Physical characteristics also matter. Next the scientists needed a convenient way to evaluate and compare the health of various bodies of water. They created the IBI – Index of Biotic Integrity – for this purpose. The components of the index vary by location, but it always consists of a number of measurements (5-10) that vary directly with the amount of human activities, for example, the amount of impervious surface, or the number of taxa (species) present. Counting the number of species captures complexity in ways that measuring a single species does not. Having good metrics for water quality allows you to do meaningful cost/benefit analysis. Which creeks should you work on? What kind of project will be most beneficial? An IBI will allow you first to identify a promising project, then measure the change that results from doing it. Since Contra Costa County has collected more data than the other Bay Area counties, the Regional Water Quality Control Board developed an IBI just for us. It is a Benthic-IBI, a subset of an overall IBI. It will be modified as other counties collect and contribute more data. Our index consists of five elements and is calibrated to what is considered perfection for our county. This does not mean a perfect creek; it is rather the best conditions attainable given the amount of human and other disturbance that has occurred. Our five metrics are:
Each of these elements is scored. Then the scores are added together to get an overall indication of conditions. Every county is required to gather data on water quality to support its Clean Water permit. At first Contra Costa County hired a consulting firm to gather the data. After about five years the local creek groups asked to collect data in the locations that interested them. For the next two years, both professionals and volunteers gathered data. Then the County decided to hire an independent consultant to compare the two sets of data. The consultant found that the volunteers did as good a job as the professionals. As a result, the County moved in 2007 to an almost all-volunteer program. A single staff person supervises the program and is present at each sampling to provide consistency and quality control. The other three people at each sampling are volunteers. Friends of the Creeks members
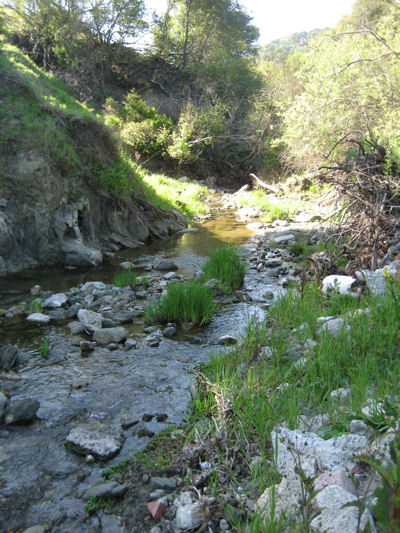
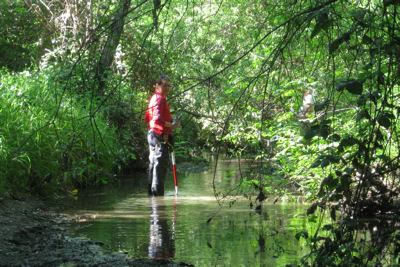
volunteered to do the bioassessment at the four sites shown in
the photos on the right. All are in the Walnut Creek
watershed.
|
 This reach of Bollinger Creek looks healthy and is. The site is high in the hills with low human influence.  This stretch of San Ramon Creek near downtown Walnut Creek has great native canopy cover and the banks are well vegetated, albeit with non-native plants. However, the dissolved oxygen is low and the water quality is only average.  Pine Creek has become a flood control channel by the time it reaches Walnut Creek – no trees, no native plants, artificial bank treatments, trash (not visible) – but still the water quality is fair.
Photos by Brad Heckman |